Project for Disaster Exposure Mapping in Kalutara, Ratnapura and Galle Districts – Sri Lanka
The World Bank’s Climate and Disaster Risk Management Unit work with governments to improve the resilience of the society. Among various approaches, the World Bank facilitates the creation of exposure datasets to empower governments’ decisions-makers with better information and planning tools to increase resiliency. In Sri Lanka, the World Bank, with a request from the Government, work with DMC in particular, to strengthen the national geospatial database, aiding line ministries to lead and navigate risk informed sector development.
This assignment complemented this effort by developing additional exposure datasets for the prioritized vulnerable districts that become part of the Government’s geospatial database. In particular, it was a pilot mapping initiative that helped National Disaster Relief Services (NDRSC) test efficient building damage assessment mechanism aiming to contribute to enhancement of efficiency of post-disaster payout operations under the National Natural Disaster Insurance Scheme (NNDIS) managed by the National Insurance Trust Fund (NITF).
![]()
This particular project developed the exposure dataset for Kaluthra, Rathanpura and Galle districts of the selected five DS divisions.
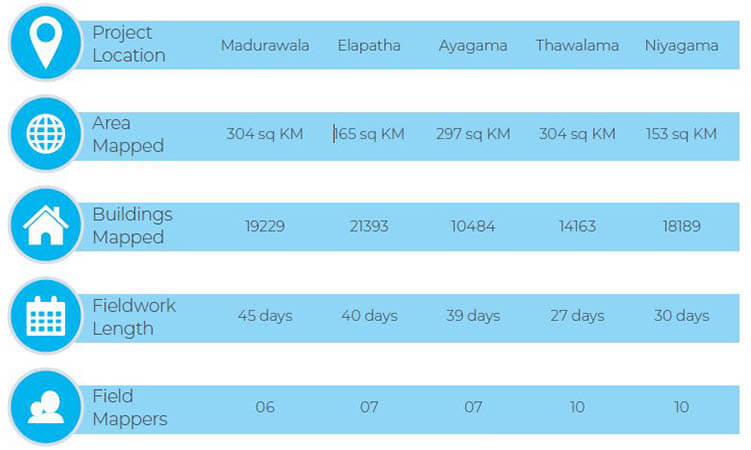
At the conclusion of the project, in Madurawela DS division of Kaluthara district had covered 304 sq km and it had 19229 number of buildings. Ayagama and Elapatha DS divisions of Rathnapura district had covered 462 sq km and 31877 number of buildings. Finally, Niyagama and Thawlama DS divisions of Galle district had covered 457 sqkm and 32352 number of buildings.
The developed exposure mapping data sets help to manage sustainable and resilient urban development, policy-makers and the public must have access to robust and accurate data to support informed decisions. These decisions include how to plan in the face of rapid urbanization, guide development away from hazard-prone areas, develop zoning for residential, commercial and industrial land use, deliver quality urban services to citizens, ensure safety of public and private assets, adopt strategies for low-emissions development that safeguard environmental assets, manage potential climate impacts such as urban heat island effects and inland and coastal flooding.
Sharing data and creating open systems promotes transparency, accountability, and it ensures that a wide range of actors are able to participate in the challenges of building resilience in urbanization processes. OpenDRI facilitated to empower decision-makers with better information and planning tools to increase resiliency.
Basic data that was required such as maps, statistical information, GN details, historical flood information, GN boundary, contact details were collected during the May and June 2020 stakeholder meetings and discussions.
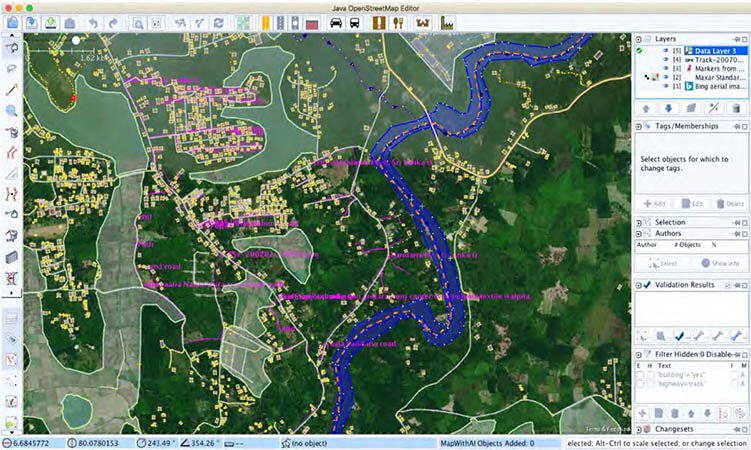
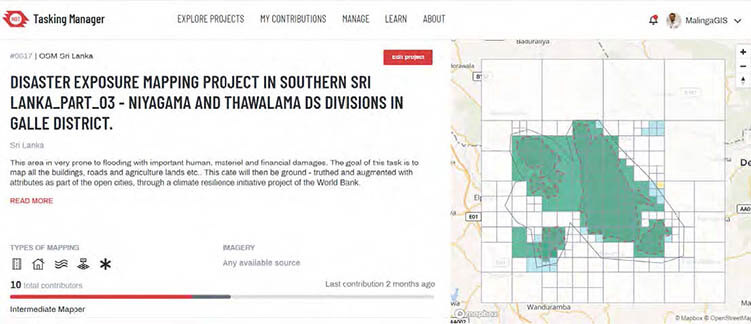
The initial step of the exposure survey began with digitizing the geographical features (such as buildings, roads, etc.) into OSM’s database. Bing satellite image, which was offered on JOSM, was used as the secondary data to trace the geographic features. The other notable data sources were paper maps of roads and key facilities of the five DSDs. JOSM, QGIS and Tasking Manager were used as digitizing tools. Digitizing activity was divided into three tasks for convenience:
- Trace the building footprints using JOSM
- Update the point of interests.
- Trace the roads
Thereafter, ODK Collector and OpenMapKit were used as mobile applications for data colletion along with field papers where needed. After the data collection form is set up in the OpenMapKit Server, we download the data collection form via ODK Collector and open the OpenMapKit application though it. Completed data forms were uploaded to the OpenMapKit Server and the accumulated OSM map was downloaded into the JOSM.
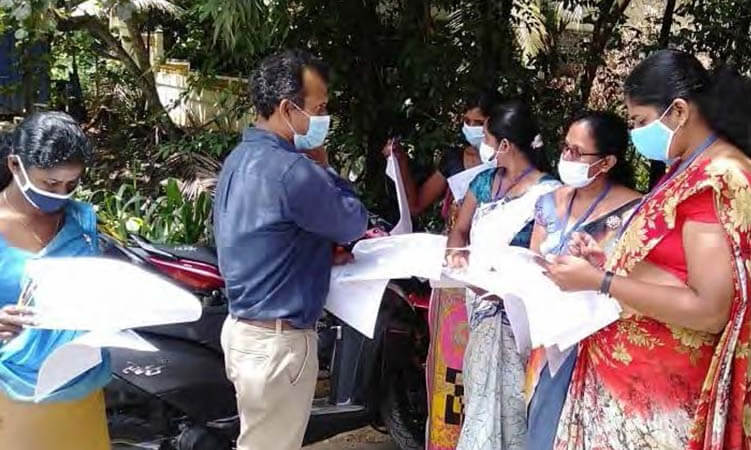
Initial trainings were conducted for over 120 District officers (DO) to help gather the data. In most cases, DO’s were very eager to facilitate the whole operation going above and beyond there call of duty.

Subsequently, the data entered were verified in the field using simple and random sample methods, the team choose a set of questionnaires from the compiled/filled questionnaires, and conducted the verification accordingly
Data cleaning and Quality Assurance of the collected data was conducted by a dedicated team. The team had checked each and every record thoroughly. By using Map Campaigner, OSMCHA and OSMOSE, data quality was checked and cleaned and submitted as the final data sets.
The comprehensive data was developed with an appropriate database architecture, which was designed in consultation with the stakeholders. The data is spatially referenced, with appropriate and agreed spatial coordinate systems and projections. The spatial database was created in accordance with internationally accepted standards and specifications in the GIS environment, maintaining the interoperability of digital layers.
All the base data collected from different open source tools such as Open Street Map (OSM), Openlayer, etc. interim data layers and the final exposure data layers is compiled in the spatial database.
Table below outline a top level summary of the work completed for this project for the five DS’s.
Lessons Learned:
- Practical field training was more beneficial than classroom training – Development Officers and NDRSC Officers learned how to use Field Papers, OpenMapKit faster through practical training focused on hands-on experience of exposure mapping in relevant areas. This allows the team to increase their confidence level before the in person data collection.
- Sharing past mapping projects experiences and challenges to overcome the difficulties on what should guide the exposure mapping – We held open sessions for Development Officers to tell us about their past experience of mapping projects and discussed issues important to them. These discussions led to valuable insights that helped us focus on strategies to avoid those during the exposure mapping.
- Focus on teaching map literacy – Even with the use of GPS enabled mobile tabs and reference maps, map literacy was a major challenge in every GN Division. We attached the large reference maps with the grids to a mapset and checked in with groups to verify that the Development Officers could correctly identify the locations.
- Redundancy keeps activities on track – In Kalutara and Madurawala, we originally planned to use OpenMapKit. However, during the data collection, battery power of the mobile tabs was draining faster than we expected, and resorted to the paper-based methods. The issue was addressed with limited power banks. However, this experience highlights the importance of contingency tools and plans in case things do not go as expected during field work.
Challenges:
- Social distancing and limited access with Covid-19 – The greatest challenge was the Coronavirus pandemic situation of the country. Sri Lanka was totally locked down for several months and in some parts of the country, still functioning at a handicapped capacity. It was challenging to manage Development Officers since they would need to interact with the households on a one on one capacity. While we provided the safety materials and directions with the support of the NDRSC, the whole project process drastically slowed down, unexpectedly. As such, we had to increase the monitoring and coordination capacity to complete the work.
- General election period caused to reduce the development officers’ effort to the project – During the period of general election, Development Officers had to engage with the election duties, making them absent from the project related work. As such, only a minimum amount of work was conducted within that time frame.